
Photo by Tech Daily on Unsplash
Hey there!
Have you ever had the idea for a personal project but couldn't find the right dataset for you?
I was in your shoes when I wanted to create a Power BI report for HR (Human Resource) data with a monthly breakdown.
And update it every month with a new data file, while keeping the old data files in place.
To get started, I needed a dataset with employee data for several months, separately for each month.
Fortunately, I came across the HR dataset created by obviEnce, which is also the dataset used in the Microsoft Power BI HR sample. It has employee data for each month in a separate csv file, which I could use to build a number of HR data metrics like headcount and number of new hires.
However, to make the project more interesting, I thought of creating another set of data files to replicate a second data source. This dataset would contain data from the hiring process and help create other metrics such as the number of vacancies and filled roles in the company over time.

The Project Idea
In this post, I'm going to go through the process of how I used Python to generate the vacancy dataset. This may be useful if you ever wanted to build something similar and did not have the access to an open dataset with multiple files.
Before we get started,
It may be useful to look at pros and cons in this approach. If you're able to find one, it's always better to use a dataset from real world over a generated dataset. It brings in the 'real-world' aspect, because it'll have actual patterns that you can use to build a story around your data.
However, because my main goal for this project is simply visualising data using Power BI, it's sufficient to use a generated dataset. I tried to bring in the real-world aspect by using random sampling, a hiring timeline and predefined proportions to add variety to the data. I'll explain how to incorporate these ideas in the next sections of this post.
A brief look at the first data source - Employee data
Before we dive into vacancy data, let's first look at the data from obviEnce. Because both data sources should be coming from the same company, the vacancy dataset will need to share some information from this data.
These are the columns from our first data source:
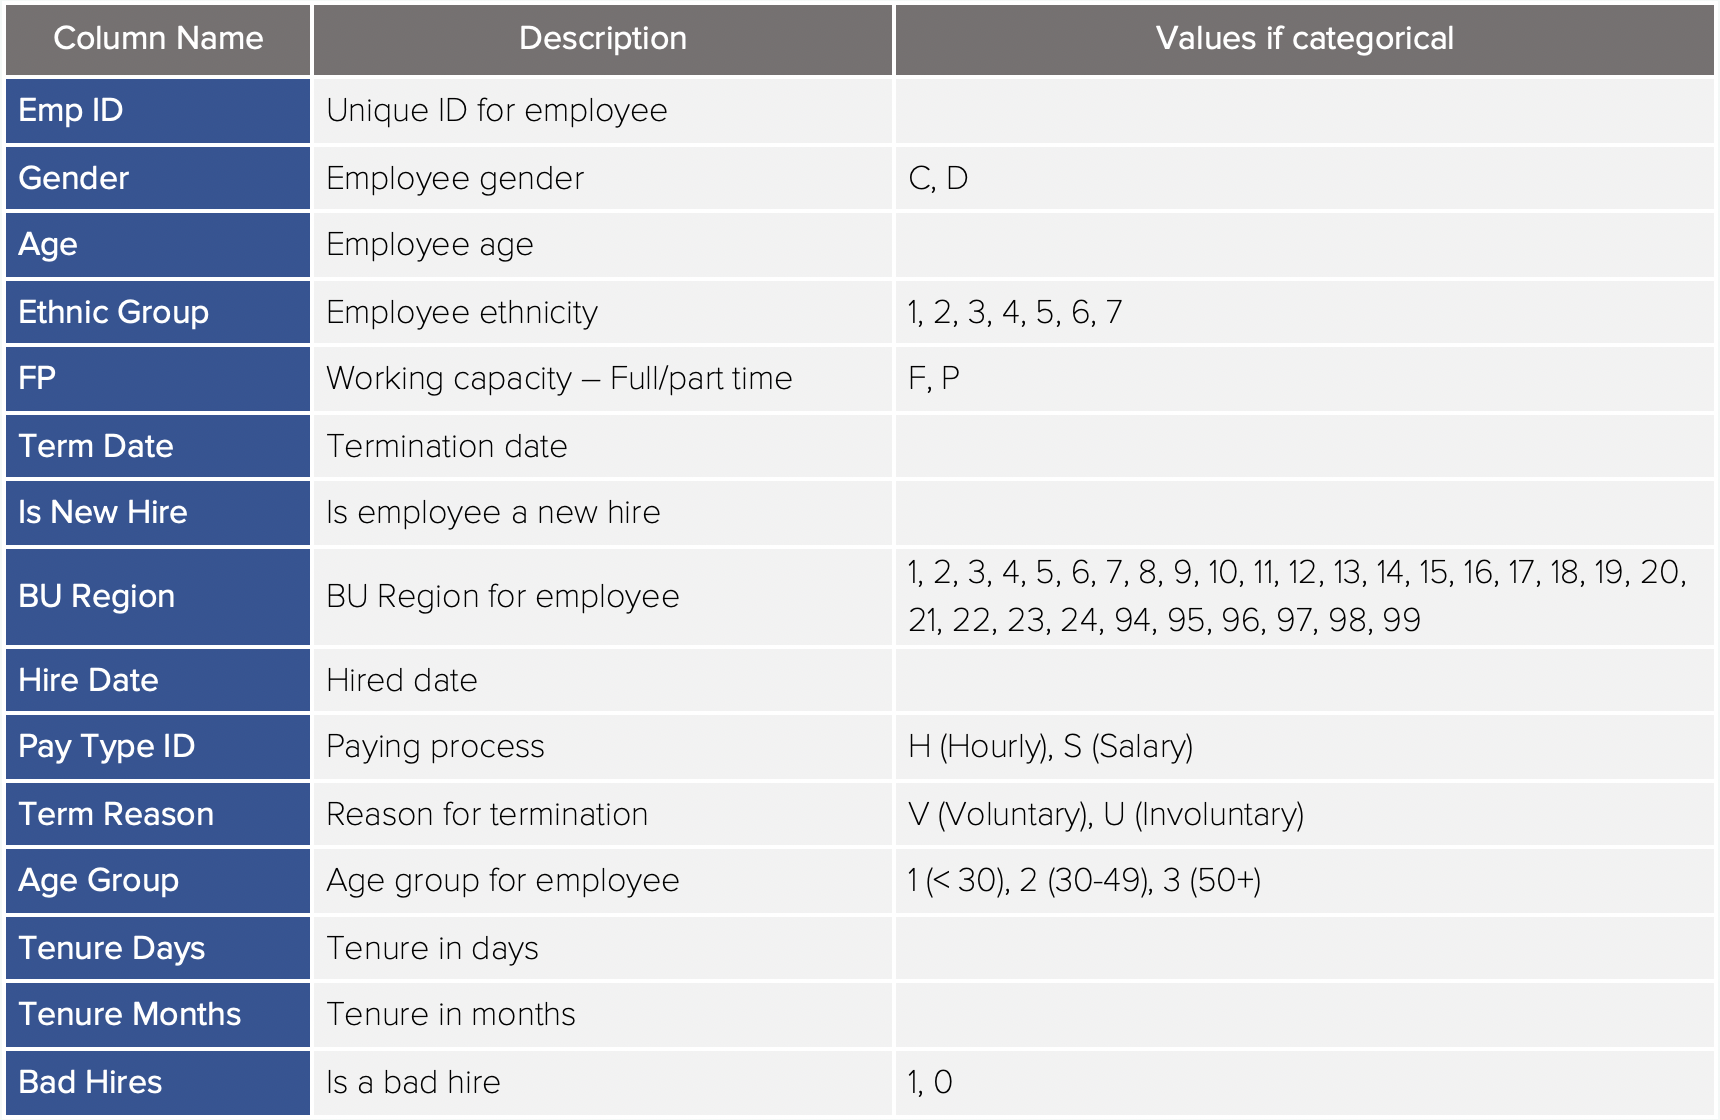
Data Description for the first dataset
From these variables, I've chosen to use the 'FP' and 'BU Region' columns to indicate vacancies for full/part-time positions in different BU regions.
Let's also have a look at the count of new hires (those who started working, not just hired) from the Employee dataset.
In my Python notebook, I first import the packages.
import pandas as pd
import numpy as np
import random
import calendar
import glob
import os

import matplotlib.pyplot as plt
%matplotlib inline
And plot the number of new hires:
# plot new hire count in employee data

# get current working directory
cwd = os.path.abspath(os.getcwd())
# get all files in directory
files = glob.glob(cwd + "/Employee data/*")

months = []
newHires = []

for file in files:
    df = pd.read_csv(file)
    # get the count of new hires
    newHires.append(df['isNewHire'].sum())
    # get the month for the file
    months.append(pd.to_datetime(df['date'][0], dayfirst=True).month)

# sort new hires based on month
newHires = [x for _,x in sorted(zip(months, newHires))]
months = sorted(months)
# replace month numbers with names
months = [calendar.month_name[i] for i in months]

# plot new hires
fig, ax = plt.subplots(figsize=(15,8))
bars = ax.bar(months, newHires)
# add data labels
for i,v in enumerate(newHires):
    ax.text(i,v+20, int(v), ha='center')
plt.title('New Hires')
plt.show()

print('All new starters for the year: ', sum(newHires))
which gives us the graph below:
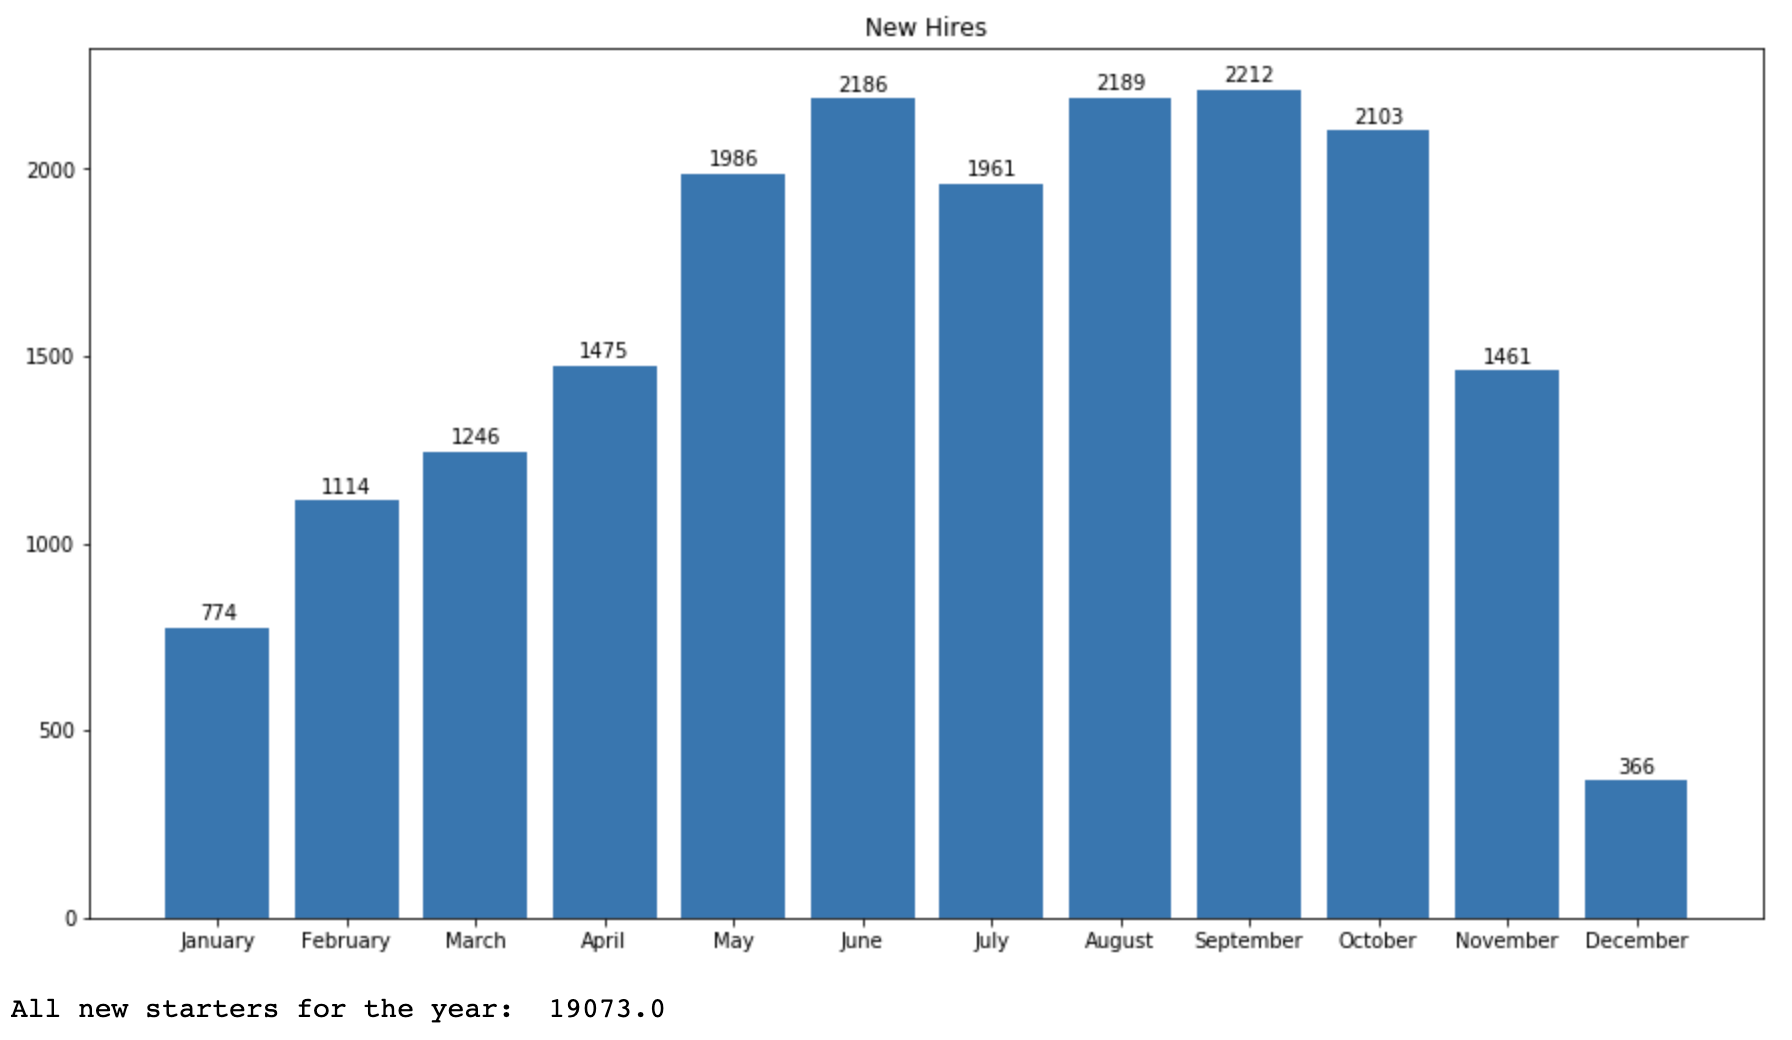
New hire count from the first dataset
As you can see, there is some variation in the total of new hires over the year, and the total new hire count is at 19073. To keep the counts similar, we'll create 20000 vacancies in our vacancy dataset.
Timeframe for the dataset
Next, let's look at the time duration for which we will be generating data. As I'll be using the data within January 2014 to December 2014 from the first data source, I've defined the same time period for vacancy dataset as well.
Let's define the number of vacancies for the year, and start and end dates for the timeframe.
n_vacancies = 20000
year = '2014'
min_date = pd.to_datetime(year + '/01/01')
max_date = pd.to_datetime(year + '/12/31')
Data Generation
I'll be following a two-step process in data generation. First, I created the complete list of vacancies for the timeframe of one year.
In the next step, I'll be slicing and storing the data in separate files for each month.
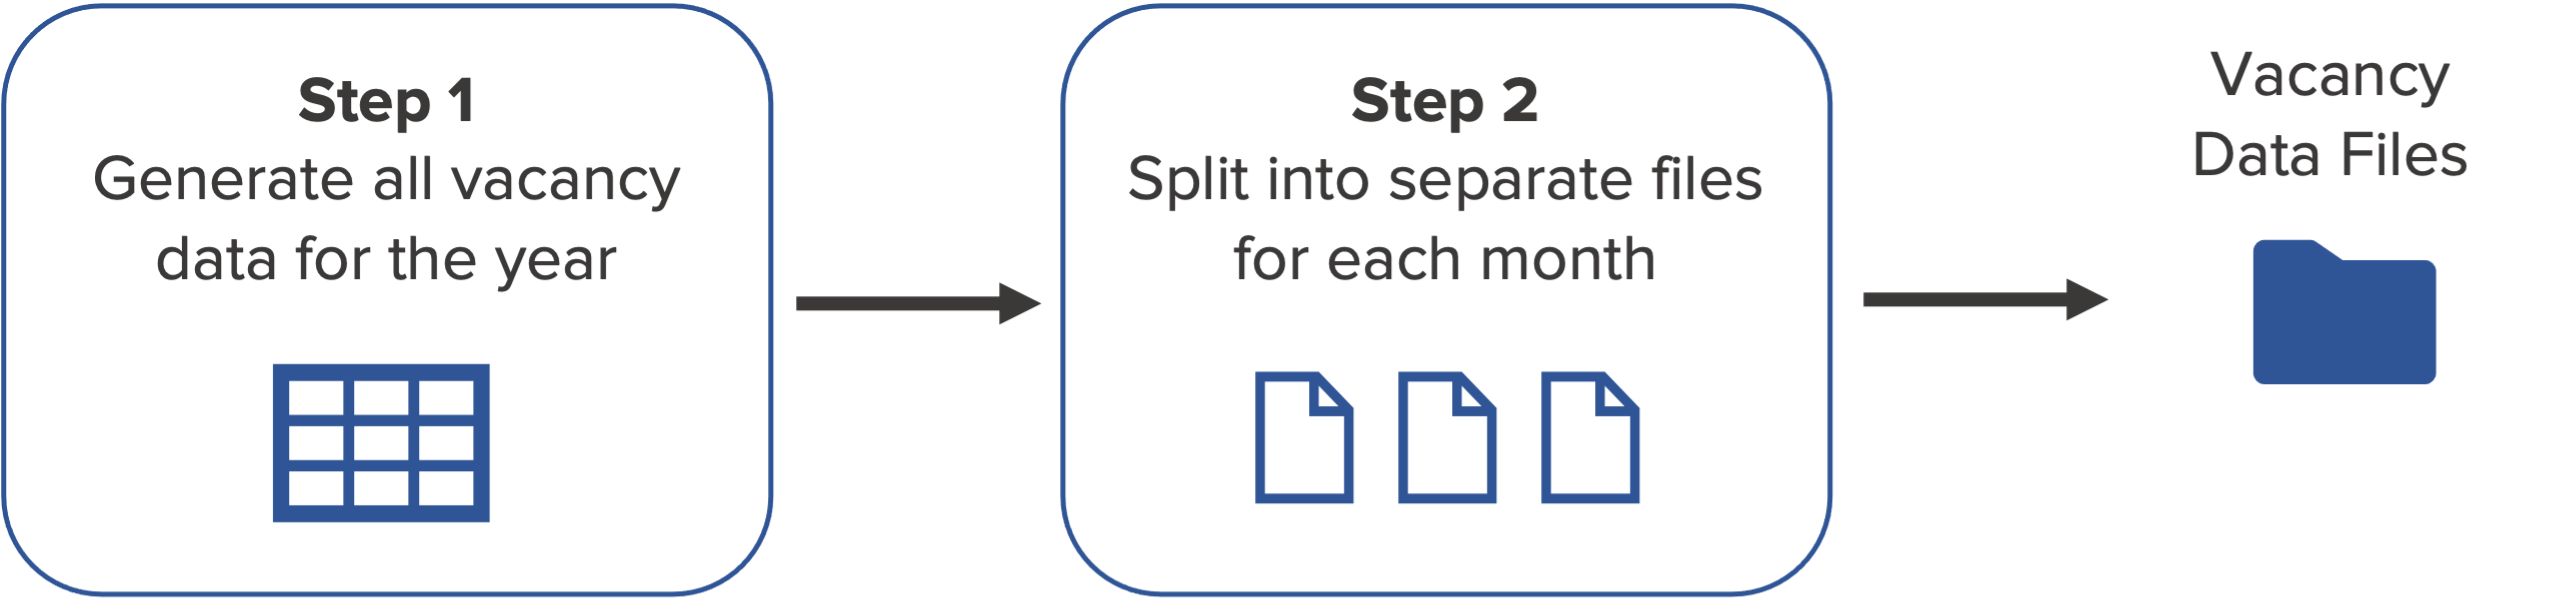
Overview of the Data Generation Process
1. Generate all vacancy data
Generate IDs and add categories from first dataset
We'll get started by creating random and unique IDs for the vacancies.
And randomly assign categories from FP and BU Region columns from the first dataset.

First three columns in the vacancy dataset
In my function to generate all vacancy data, I'm adding the ID, FP and BU Region columns.
To generate IDs, I'm using random.sample() function to do random sampling without replacement. To assign FP and BU Region,
I'm using random.choice() from Numpy to pick items with replacement.
# generate all vacancy data

def generate_vacancy_data(n_vacancies):
    vacancy_df = pd.DataFrame()
    # create random ids for each row
    vacancy_df['ID'] = random.sample(range(1,n_vacancies+1), n_vacancies)
    # randomly add values for FP and BU Region columns
    vacancy_df['FP'] = np.random.choice(['F','P'], n_vacancies, replace=True)
    regions = [1, 2, 3, 4, 5, 6, 7, 8, 9, 10, 11, 12, 13, 14, 15, 16, 17, 18,
                              19, 20, 21, 22, 23, 24, 94, 95, 96, 97, 98, 99]
    vacancy_df['BU Region'] = np.random.choice(regions, n_vacancies, replace=True)
Generate dates based on the hiring timeline
Next, I'll be adding more columns to explain the status of vacancies over time.
For this purpose, I've defined a hypothetical hiring timeline that we can assume that the company is using in their hiring process.
The image below shows the major milestones for a single vacancy.

Hiring timeline
I had fun creating this using my own imagination. The main purpose was to bring in some aspects followed in a real-world hiring process.
Each vacancy would have an Approved Date which indicates when the vacancy was created. To generate random approved dates
spread across the year, I'm using pd.to_timedelta() function to add a random number of days to the first date of the year.
    # get the number of days in the time period
    n_days = (max_date - min_date).days + 1
    # generate random approved dates
    vacancy_df['Approved'] = min_date + pd.to_timedelta(np.random.randint(n_days, size=n_vacancies), unit='d')
Usually companies have some of their vacancies put on hold. To replicate this, a defined portion of 1% of all
vacancies were to be put on hold. The On hold date would fall within 10-30 days from the Approved date.
    # add empty column filled with NaT
    vacancy_df['On hold'] = pd.NaT
    # generate 1% on hold vacancies by selecting 1% of rows
    a = vacancy_df.sample(frac=0.01)
    # generate random on hold dates for the selected rows in 10-30 days after approved date
    a['On hold'] = a['Approved'] + pd.to_timedelta(np.random.randint(low=10, high=30, size=a.shape[0]), unit='d')
    # replace modified rows in original dataset
    vacancy_df.loc[a.index, 'On hold'] = a['On hold'].dt.date
Then, I'm using the same approach to add the Sourcing start, Interview start, Interview end, Offered and Filled
dates based on the hiring timeline. Finally, I've removed the date values for On hold vacancies.

Generated columns in the Vacancy dataset
With the addition of this section, we now have the complete function to generate all vacancy data.
# generate all vacancy data

def generate_vacancy_data(n_vacancies):
    vacancy_df = pd.DataFrame()
    # create random ids for each row
    vacancy_df['ID'] = random.sample(range(1,n_vacancies+1), n_vacancies)
    # randomly add values for FP and BU Region columns
    vacancy_df['FP'] = np.random.choice(['F','P'], n_vacancies, replace=True)
    regions = [1, 2, 3, 4, 5, 6, 7, 8, 9, 10, 11, 12, 13, 14, 15, 16, 17, 18,
                              19, 20, 21, 22, 23, 24, 94, 95, 96, 97, 98, 99]
    vacancy_df['BU Region'] = np.random.choice(regions, n_vacancies, replace=True)

    # get the number of days in the time period
    n_days = (max_date - min_date).days + 1
    # generate random approved dates
    vacancy_df['Approved'] = min_date + pd.to_timedelta(np.random.randint(n_days, size=n_vacancies), unit='d')
    # add empty column filled with NaT
    vacancy_df['On hold'] = pd.NaT
    # generate 1% on hold vacancies by selecting 1% of rows
    a = vacancy_df.sample(frac=0.01)
    # generate random on hold dates for the selected rows in 10-30 days after approved date
    a['On hold'] = a['Approved'] + pd.to_timedelta(np.random.randint(low=10, high=30, size=a.shape[0]), unit='d')
    # replace modified rows in original dataset
    vacancy_df.loc[a.index, 'On hold'] = a['On hold'].dt.date

    # generate sourcing start date to be within 5-10 days after approved date
    vacancy_df['Sourcing start'] = vacancy_df['Approved'] + pd.to_timedelta(np.random.randint(low=5, high=10, size=n_vacancies), unit='d')
    # generate Interview start date to be within 10-20 days after sourcing start date
    vacancy_df['Interview start'] = vacancy_df['Sourcing start'] + pd.to_timedelta(np.random.randint(low=10, high=20, size=n_vacancies), unit='d')
    # generate Interview end date to be within 15-30 days after interview start date
    vacancy_df['Interview end'] = vacancy_df['Interview start'] + pd.to_timedelta(np.random.randint(low=15, high=30, size=n_vacancies), unit='d')
    # generate Offered date to be within 5-10 days after interview end date
    vacancy_df['Offered'] = vacancy_df['Interview end'] + pd.to_timedelta(np.random.randint(low=5, high=10, size=n_vacancies), unit='d')
    # generate Filled date to be within 5-10 days after offered date
    vacancy_df['Filled'] = vacancy_df['Offered'] + pd.to_timedelta(np.random.randint(low=5, high=10, size=n_vacancies), unit='d')

    # remove values for on hold vacancies
    vacancy_df.loc[a.index, ['Sourcing start', 'Interview start', 'Interview end', 'Offered', 'Filled']] = pd.NaT

    return vacancy_df
I'm sure you're curious to see how it would turn out after running this function.
And we've got the answer here:
# generate complete dataset
vacancy_df = generate_vacancy_data(n_vacancies)
vacancy_df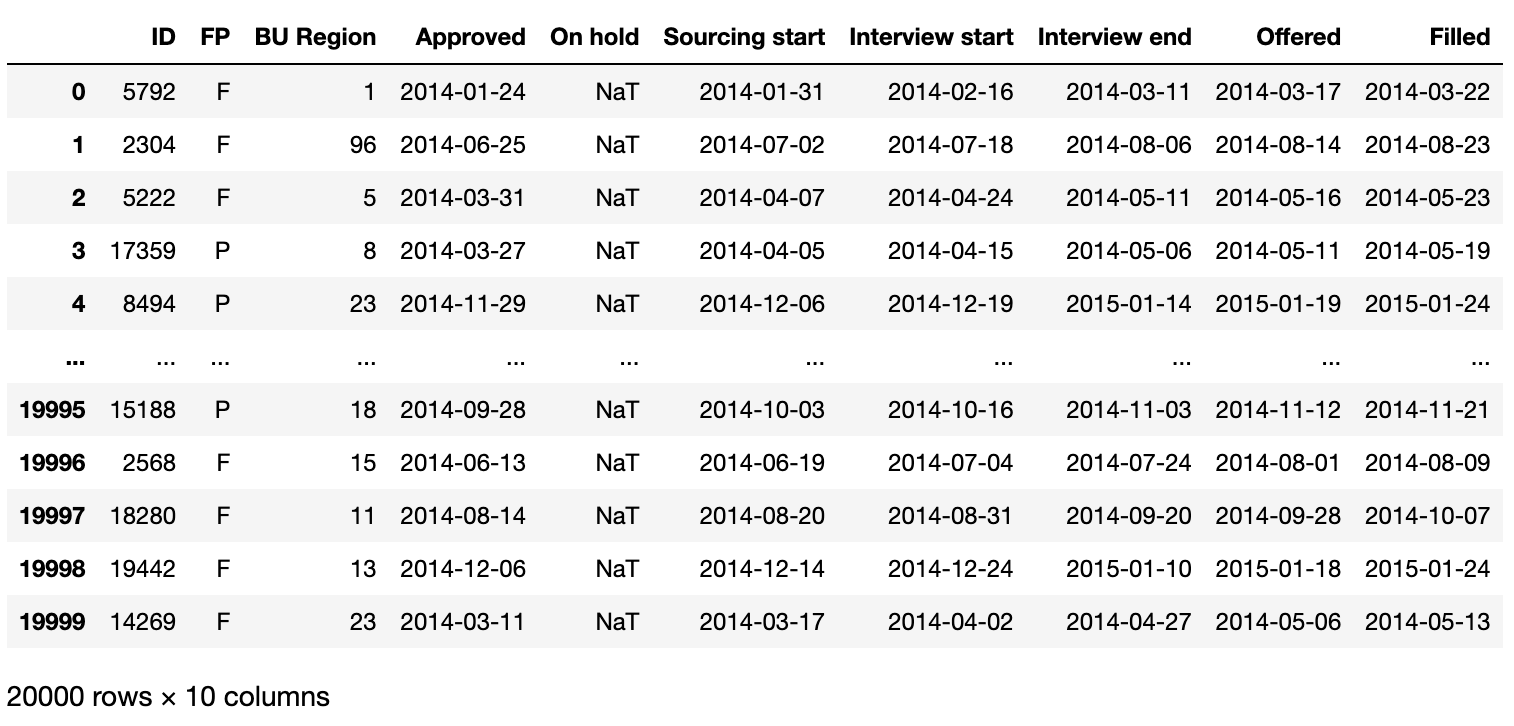
Vacancy data generation output
Why I'm getting a different output?
If you tried this out, you may notice that you get a different output from what's shown here. This is because we use random numbers to generate the data. If you prefer to get the same output every time, set the seed for random numbers before executing the above function. This needs to be done for both Python and NumPy random number generators.
This post is a helpful guide to using random seed in NumPy.
# set seed for Python random generator
random.seed(42)

# create NumPy random number generator
rand_gen = np.random.RandomState(42)

# replace np.random with rand_gen
2. Split data into separate files
Now that we have the complete vacancy data for the year, we can move to the next step and separate the data for each month.
For each month, I'm going to filter the dates less than or equal to the last date for the month, and replace other date values with NaT.
Next, I'll remove the roles which have Filled dates in previous months.
Finally, I'll be adding a new column called Status to indicate the status for each vacancy at the end of the month.
I'll create a new function for this purpose, and run it for each month in our time period.
# create data files for each month

def create_monthly_df(month):
    # get start date for the month
    month_start = pd.to_datetime(year + '/'+str(month)+'/01')
    # get end date for the month
    month_end = month_start + pd.to_timedelta(calendar.monthrange(int(year), month)[1]-1, unit='d')

    # create monthly data
    monthly_df = vacancy_df.copy()

    # replace dates after month end date with NaT
    monthly_df[monthly_df.columns[3:]] = monthly_df.iloc[:,3:].where(monthly_df.iloc[:,3:]<=month_end, pd.NaT)

    # replace rows with NaT if Filled date is in a previous month
    monthly_df[monthly_df.columns[3:]] = monthly_df.iloc[:,3:].where(
        (pd.isnull(monthly_df.iloc[:,-1])) | (monthly_df.iloc[:,-1]>=month_start), pd.NaT)

    # remove rows with all blank values using index
    empty_index = monthly_df[monthly_df.iloc[:,3:].isnull().all(axis=1)].index
    monthly_df = monthly_df.drop(index=empty_index).reset_index()

    # convert On hold column to datetime to be able to compare in the next step with idxmax
    monthly_df['On hold'] = pd.to_datetime(monthly_df['On hold'], errors='coerce')
    # add status column by using the max date value from the specified columns
    monthly_df['Status'] = monthly_df[['Approved', 'On hold', 'Sourcing start',
                                       'Interview start', 'Interview end', 'Offered', 'Filled']].idxmax(axis=1)
    # remove previous index column
    monthly_df = monthly_df.drop(['index'], axis=1)

    # remove NaT values
    monthly_df = monthly_df.fillna('')

    # write to csv
    file_name = 'Vacancy data/' +calendar.month_name[month] + '-' + year + '.csv'
    monthly_df.to_csv(file_name, index=False)


# generate monthly files
for i in range(12):
    create_monthly_df(i+1)
As you can see, we have a new Status column in the output for 2014 April.
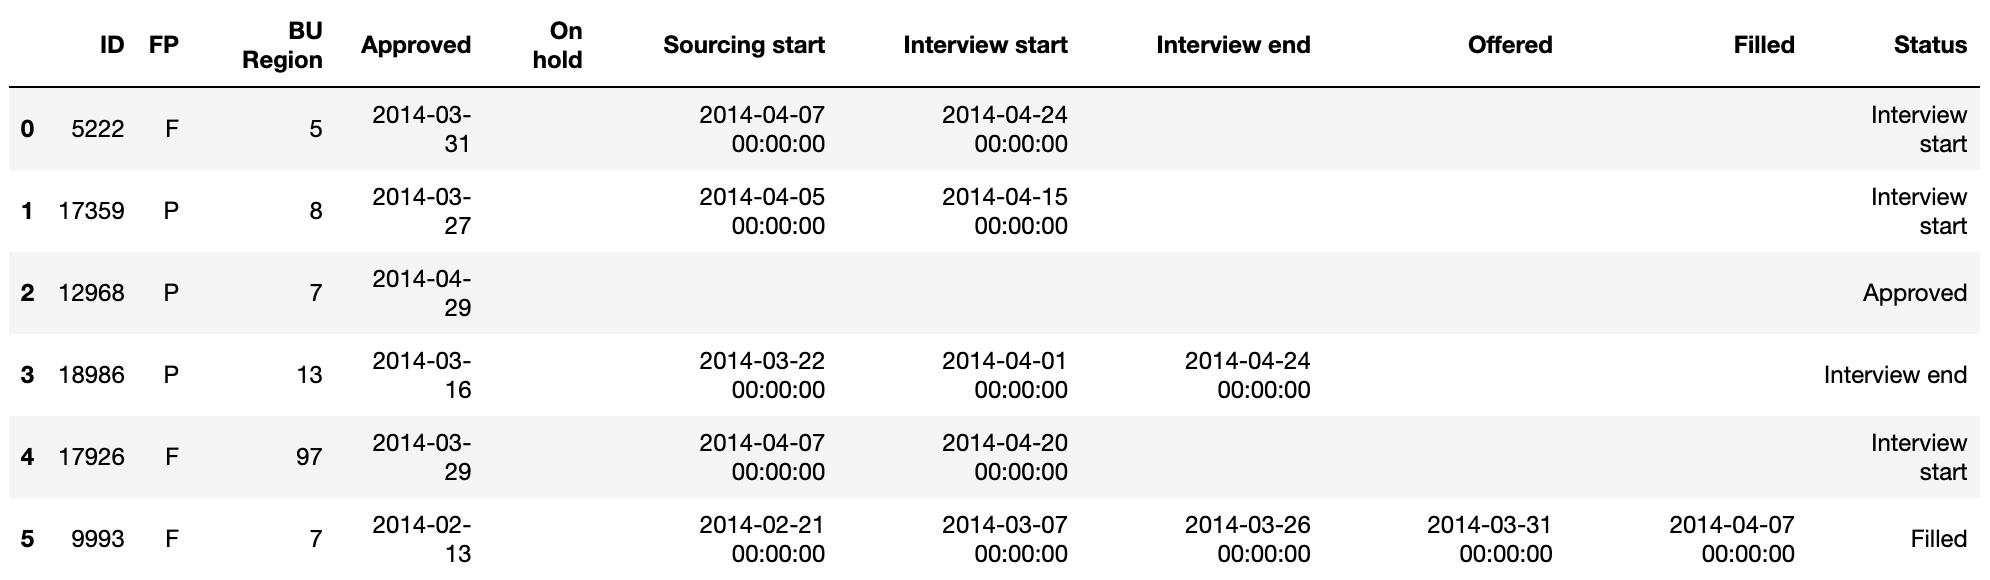
First six rows of the final vacancy dataset output for 2014 April
If you tried this out, you will have 12 csv files created for vacancy data in each month.
Each file shows the status of the vacancies at the end of the month.
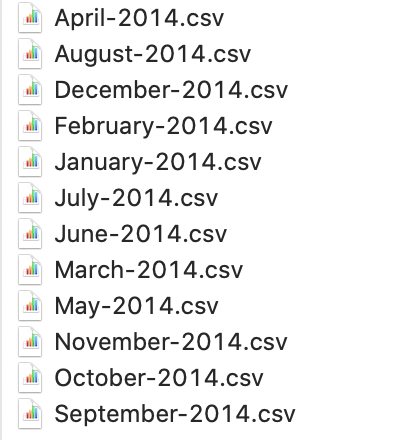
Generated data files
I had a brief look at the count of filled roles over the year using the generated data.
# plot filled roles in vacancy data

# get all files in directory
vac_files = glob.glob(cwd + "/Vacancy data/*")

months = []
filledRoles = []

for file in vac_files:
    df = pd.read_csv(file)
    # get the count of filled roles
    filledRoles.append(df[df['Status']=='Filled']['ID'].count())
    # get the month for the file
    months.append(pd.to_datetime('1-'+file.split('/')[-1].split('.')[0], dayfirst=True).month)

# sort filled roles based on month
filledRoles = [x for _,x in sorted(zip(months, filledRoles))]
months = sorted(months)
# replace month numbers with names
months = [calendar.month_name[i] for i in months]

# plot new hires
fig, ax = plt.subplots(figsize=(15,8))
bars = ax.bar(months, filledRoles)
# add data labels
for i,v in enumerate(filledRoles):
    ax.text(i,v+20, int(v), ha='center')
plt.title('Filled Roles')
plt.show()

print('All filled roles for the year: ', sum(filledRoles))
The output shows that we have a fairly similar distribution over the year as I used random sampling to generate the data.
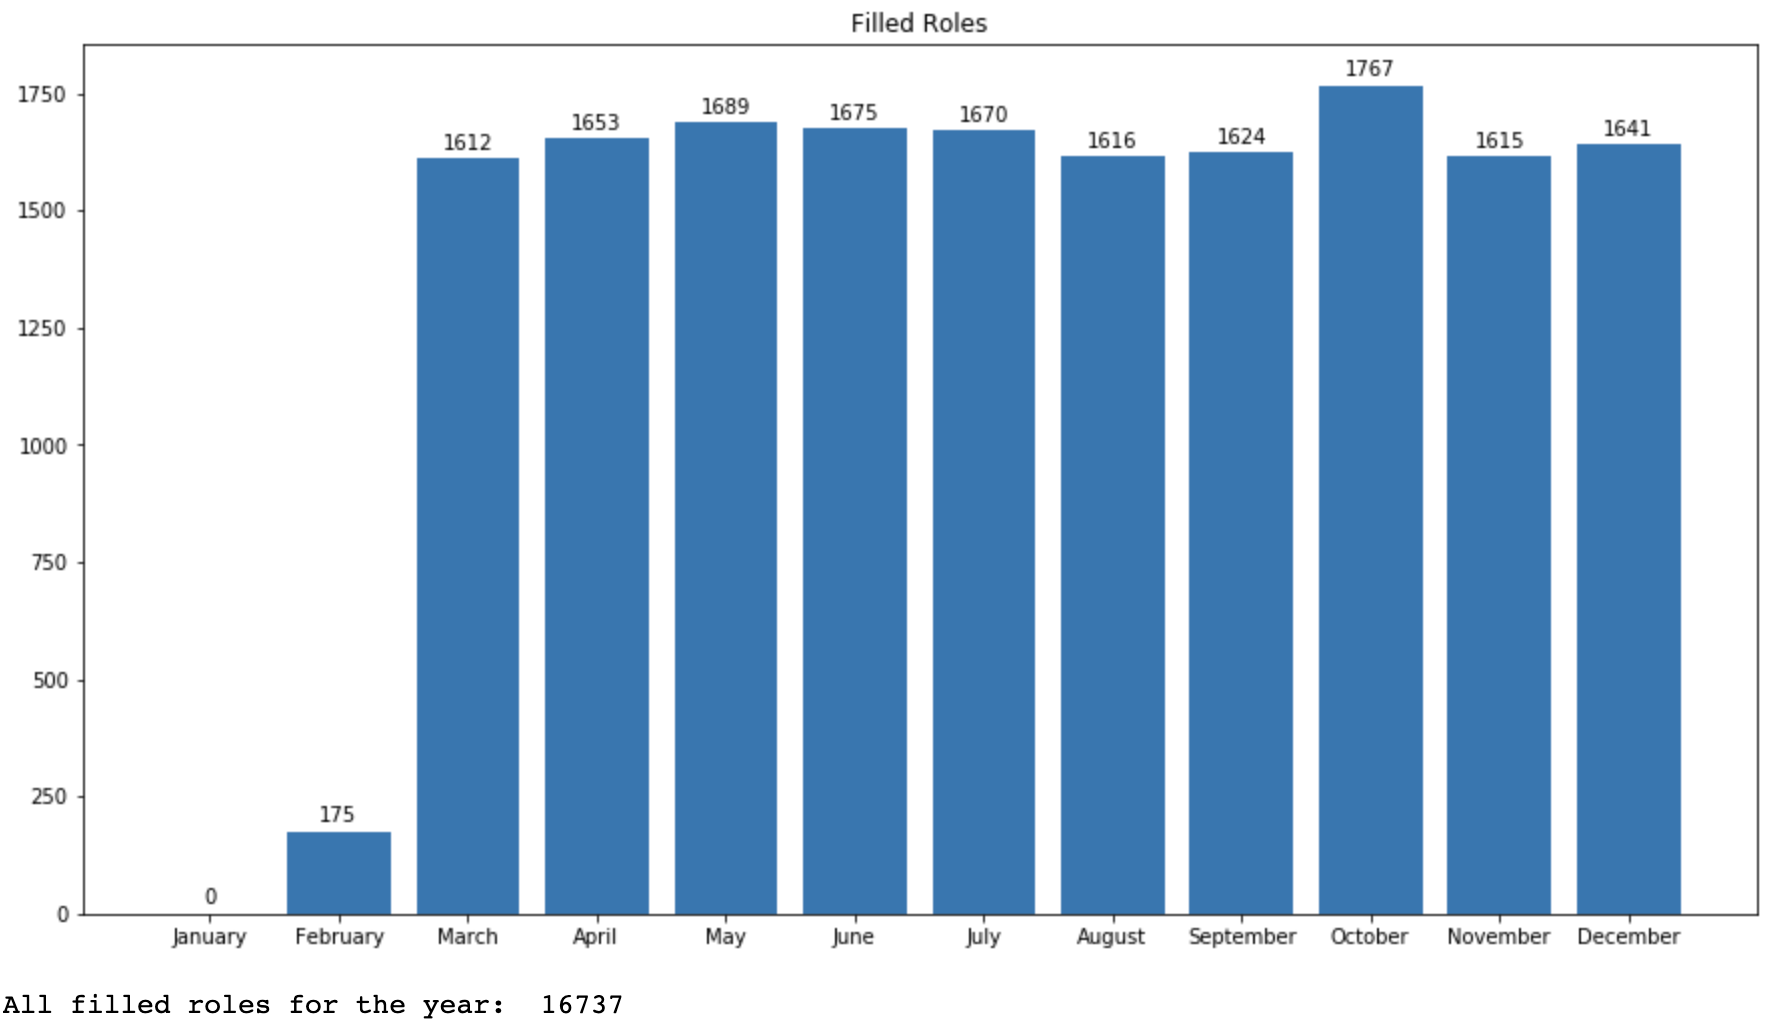
Total number of filled roles using generated data
Although the distribution is different, we can use the generated data to explore more aspects related to the hiring process - such as time taken to source candidates and time taken to fill roles.
You may be wondering about the different numbers for total hires from the first dataset, and the total filled roles from generated data. Usually in companies, these two values tend to be different because although a role was filled in one month, the employee may start working on a later date.
And that's it! That's how I generated my own dataset so that I can use it for my personal project.
Check my GitHub repository to see the complete code for this project, and view the generated dataset in Kaggle.
Have fun with Python!